TLS interception and how it broke my Openshift telemetry client

Premises
Our security team at work decided to enable TLS interception on the proxies we use to access internet resources.
If you're not familiar with TLS interception, I'll break it down for you: back in the day, we only had HTTP, meaning all of your requests and responses were sent in the clear (unless the website you were using encrypted the data on its own).
Now this obviously was an issue, since all of your data would be able to be intercepted by a third party if it could somehow sit in the middle of you and the website (suitably called "man-in-the-middle" attack).
However, this had certain benefits; for example a company proxy could monitor every request and see exactly what went to and from every client passing through. This is especially useful when bound to a heuristic tool that could detect malwares by inspecting the data for common traffic patterns (such as C&C tools).
Nowadays pretty much every website uses HTTPS, meaning the traffic is encrypted between the user and the website using a protocol called TLS. Now this in itself doesn't guarantee privacy, as a MitM could intercept the initial connection from the user, posing as the legitimate website, and re-encrypt the data after tampering with it.
To solve this issue, websites use digital certificates issued by trusted Certificate Authorities (CAs). These certificates are verified against a CA trust store by the client, which is a collection of pre-installed trusted root certificates that come bundled with your OS or browser.
When a user connects to a website, the browser checks the website's certificate against the certificates in the CA trust store to ensure it is valid and trusted (this is why when you sign a certificate on your own and use it to host a test website, your browser complains about a self-signed certificate, this is because you're not a trusted CA!)
Alright, back to the original topic, this is all good and HTTPS is awesome, but that means that our proxy interception will now cause a major issue because of how it works:
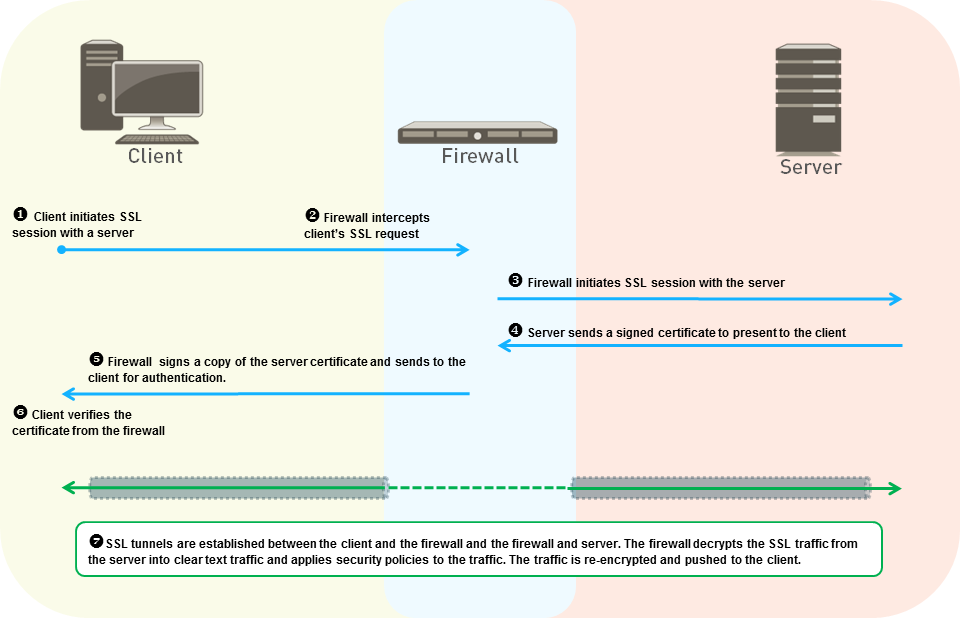
Now when the client receives its response from the handshake it made to the website, the public certificate it receives isn't signed by a standard certificate authority (such as https://letsencrypt.org/) but by our proxy or firewall own CA, thus making every request fail due to a self-signed certificate.
To fix this and allow the requests to go through, we have to add this new custom CA to the trust store of every component of our infrastructure, in our case, we must make sure that each node and pod running on our clusters trust it.
Preparation of the change
Unfortunately, adding a new certificate authority to our pods isn't as straightforward as you may think due to a few issues:
- First, there isn't a single place to put CA certificates defined in Linux-based OS, this is because it is user-space matter; therefore each distribution decides on its own, for example:
/etc/ssl/certs for debianbased distros/etc/pki/ca-trust/extracted/pemfor CentOS
- Second, we can't just modify our pods like that, for example, if a pod is managed by an operator, any modification will be overwritten instantly, so we have to check the managing object of the pod to add a new volume.
Thankfully, Openshift helps us with this process for some operators, since pretty much all Red Hat operators will automatically inject your custom CA, as long as you put them in the CA trust bundle by following this documentation:
However, you pretty much have to deal with every other internet-egressing pod manually. To help with the process, I've developed a quick script that gets every pod using our proxy, gets the operator managing it through the ownerReferences field and a bit of recursion, then check if the CA configuration is OK:

This gave me a complete list, helping me to go ahead and configure each operator to mount my new CA:
-- [ Creating Kubernetes dynamic client ]
-- [ Getting pods using any proxy (internet-egress) ]
-- [ Getting ownerReferences root for each pod ]
-- [ Listing proxy owners ]
Proxy-Owner operators.coreos.com/v1alpha1ClusterServiceVersion aap/aap-operator.v2.4.0-0.1741194076 manages:
	v1/Pod ansible-lightspeed-operator-controller-manager-599c6bc8f8-2vcvf
		Container "ansible-lightspeed-manager" is using proxy "http://hidden"
		✅ Correct CA configuration.
		Container "kube-rbac-proxy" is using proxy "http://hidden"
		✅ Correct CA configuration.

	v1/Pod ansible-lightspeed-operator-controller-manager-599c6bc8f8-2vcvf
		Container "ansible-lightspeed-manager" is using proxy "http://hidden"
		✅ Correct CA configuration.
		Container "kube-rbac-proxy" is using proxy "http://hidden"
		✅ Correct CA configuration.

	v1/Pod automation-controller-operator-controller-manager-5dc7d74dlqf79
		Container "kube-rbac-proxy" is using proxy "http://hidden"
		✅ Correct CA configuration.
		Container "automation-controller-manager" is using proxy "http://hidden"
		✅ Correct CA configuration.

[...]
D-Day of the change
On the day of the TLS interception, I spent an hour looking over each pod and metric to confirm that everything was okay.

And while pretty much everything went smoothly, something had to break because, as we say in France: "it would be too funny otherwise".
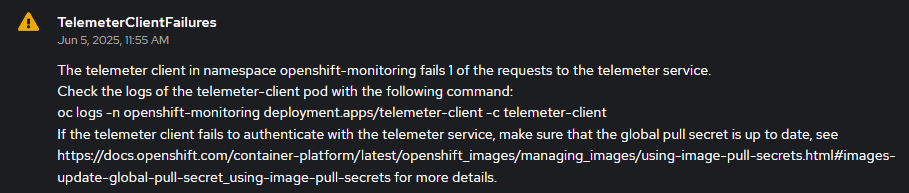
This is the component responsible for sending the cluster status and alarms to the Openshift hybrid console (https://console.redhat.com/), my first reaction was just: "oh, forgot about this one maybe", but it was weird, as this was an Openshift managed pod and should be working fine.
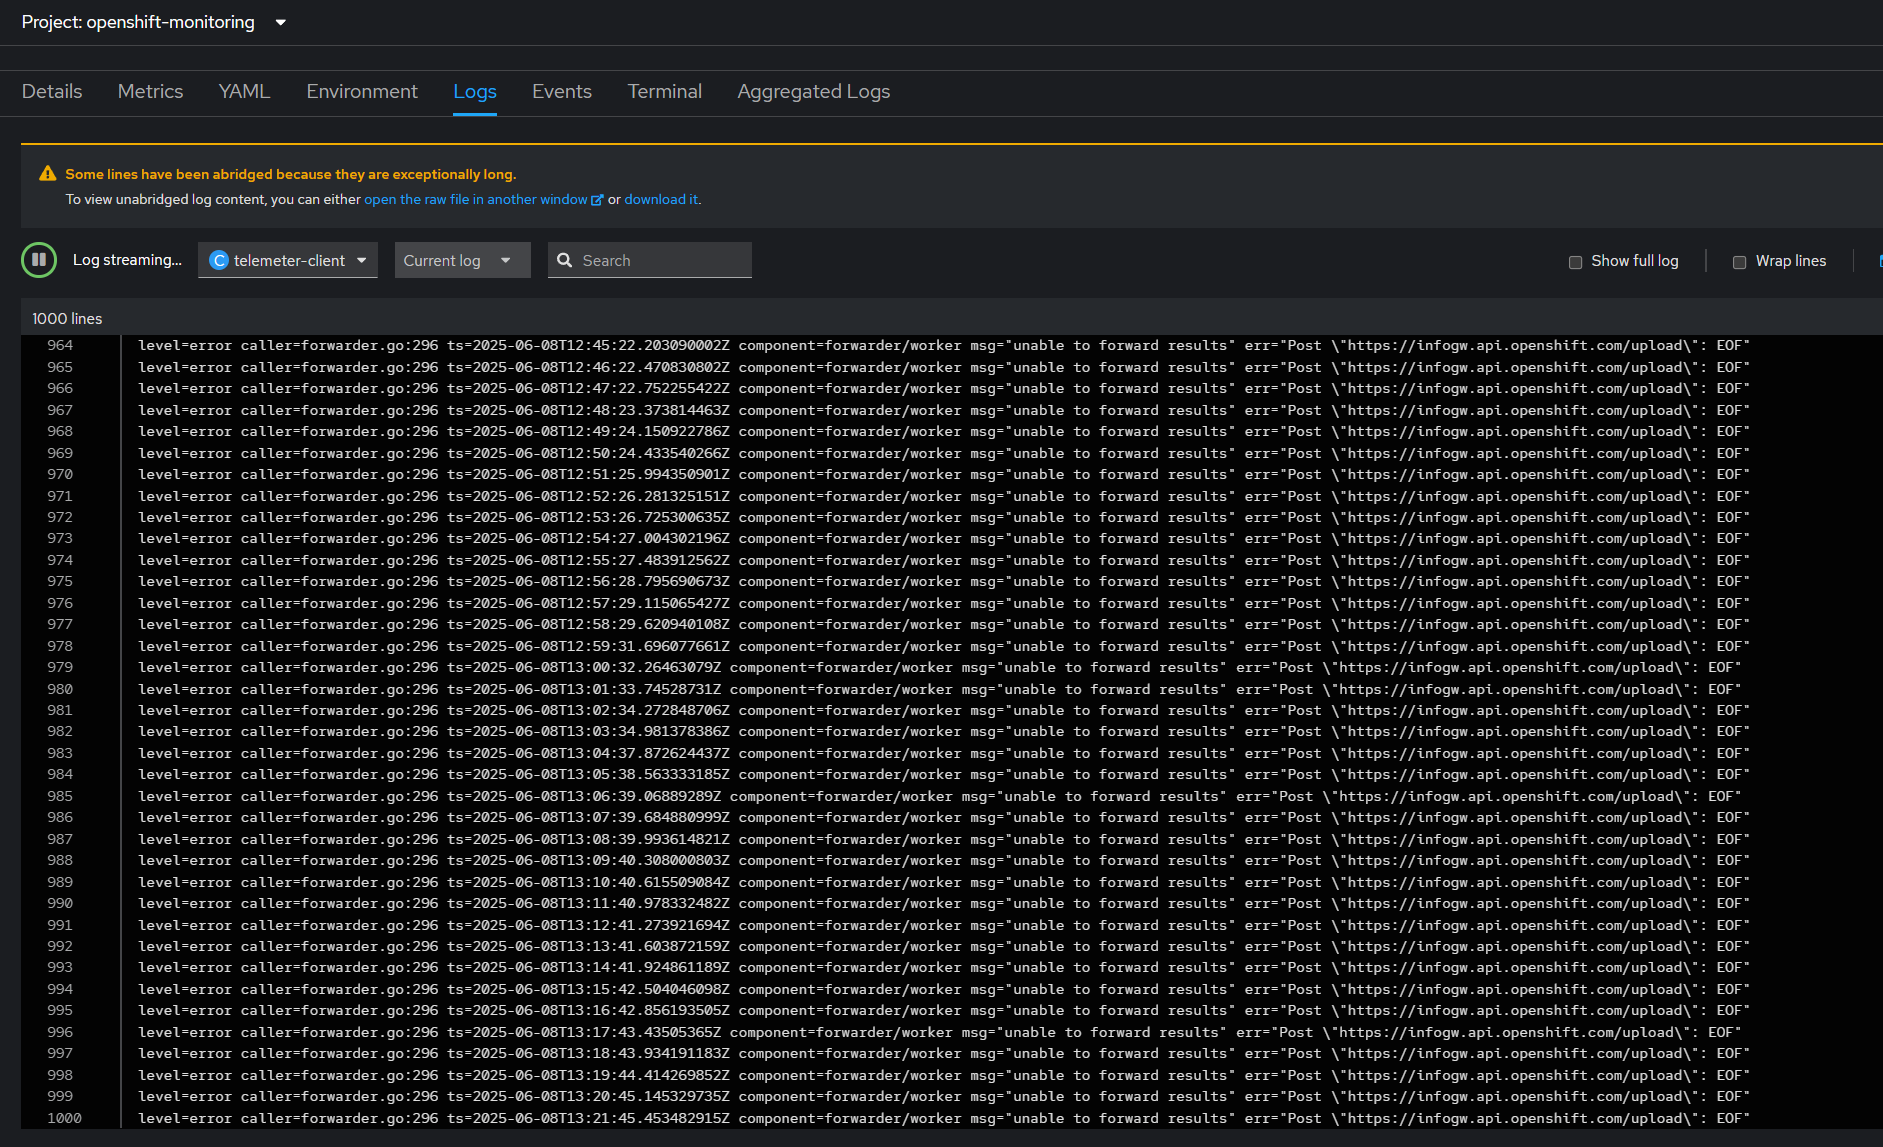
Looking at the logs confused me even more. Usually if you misconfigure the trust store on a pod, you get an error like "self-signed certificate in the chain" or "cannot verify certificate", but this was worse, just a single EndOfFile error.
Time to debug.
Debugging time 😺
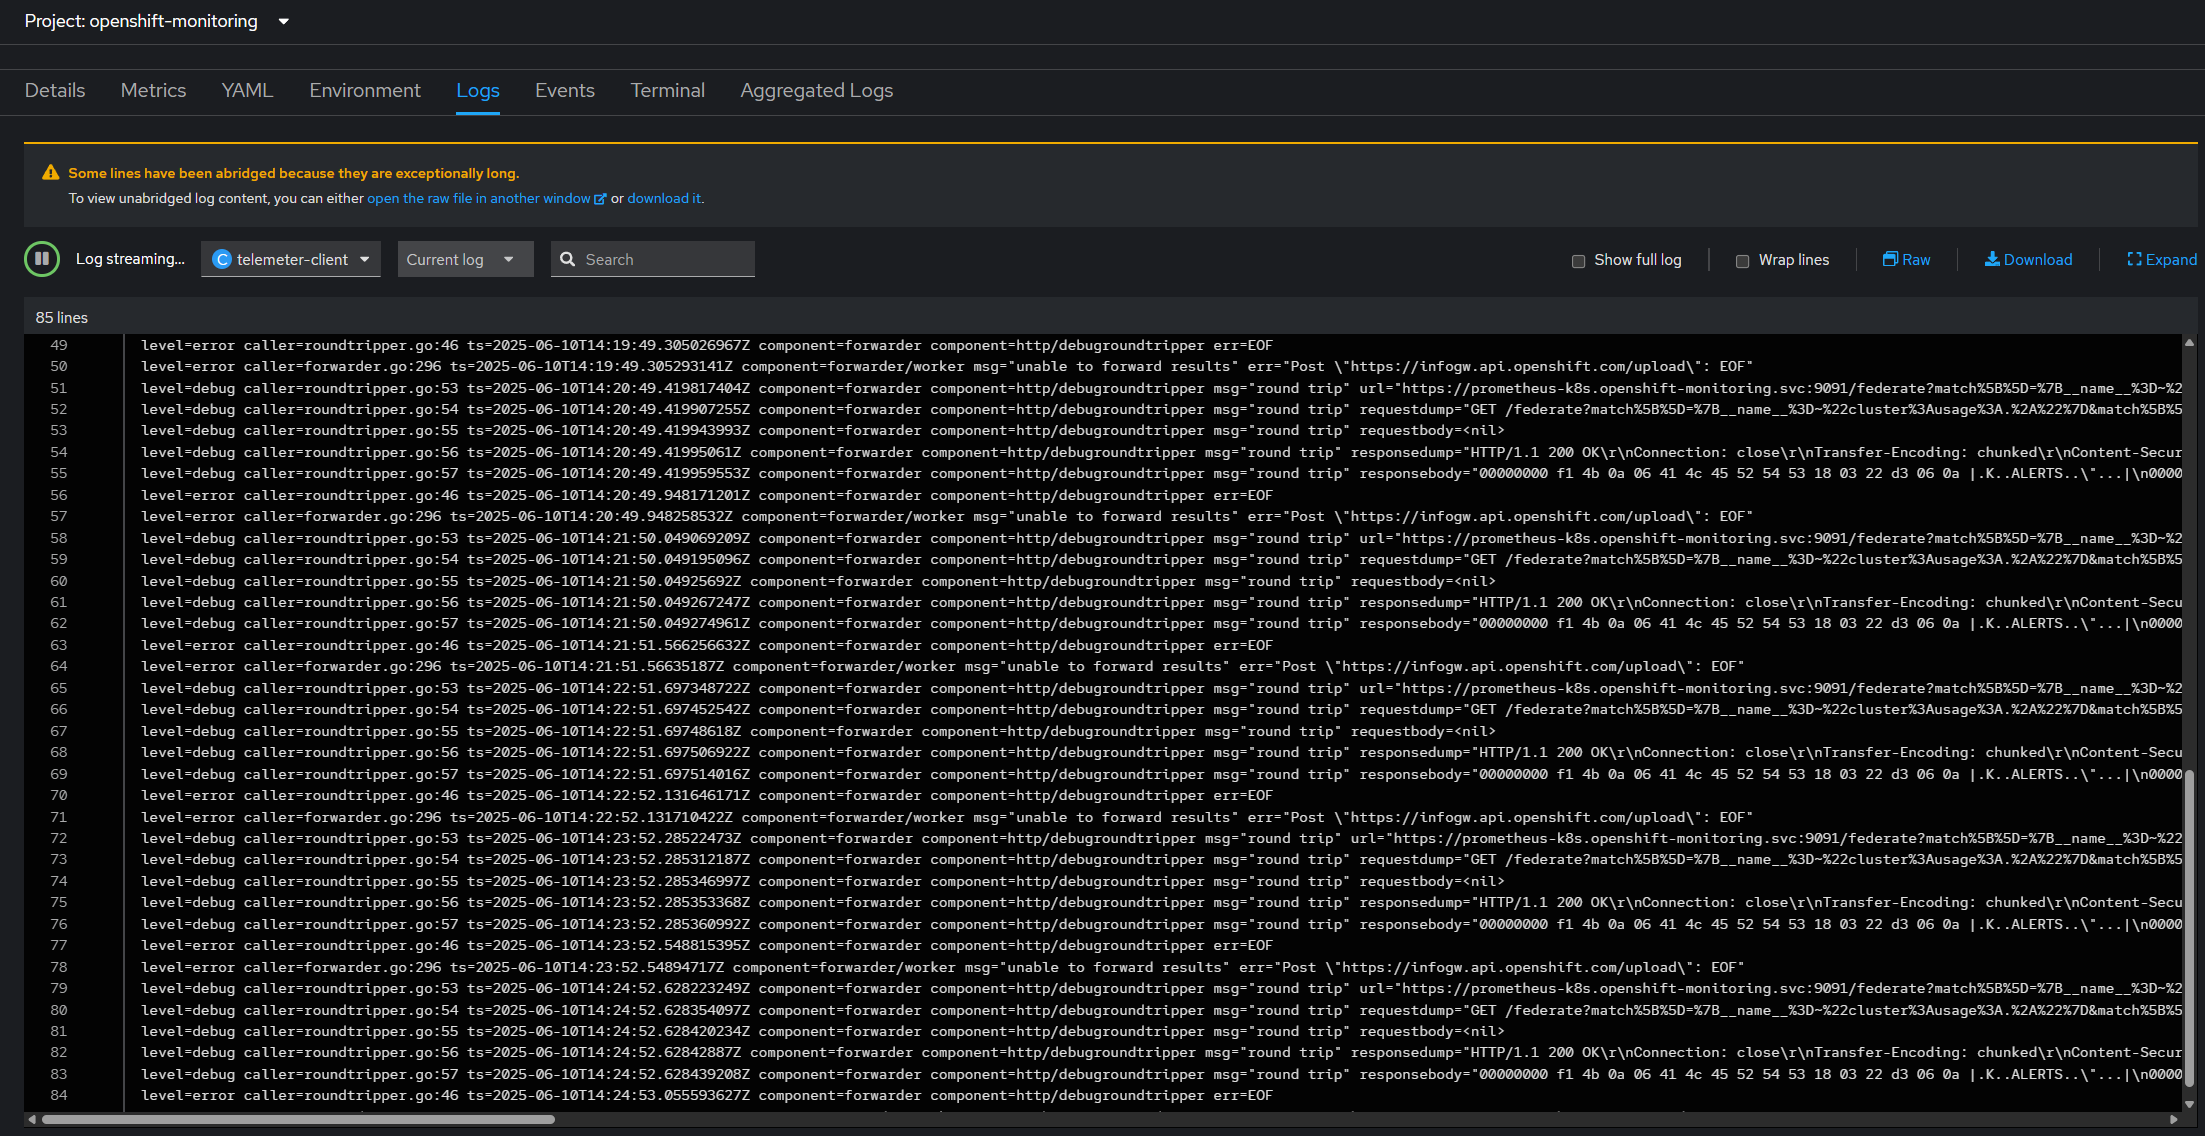
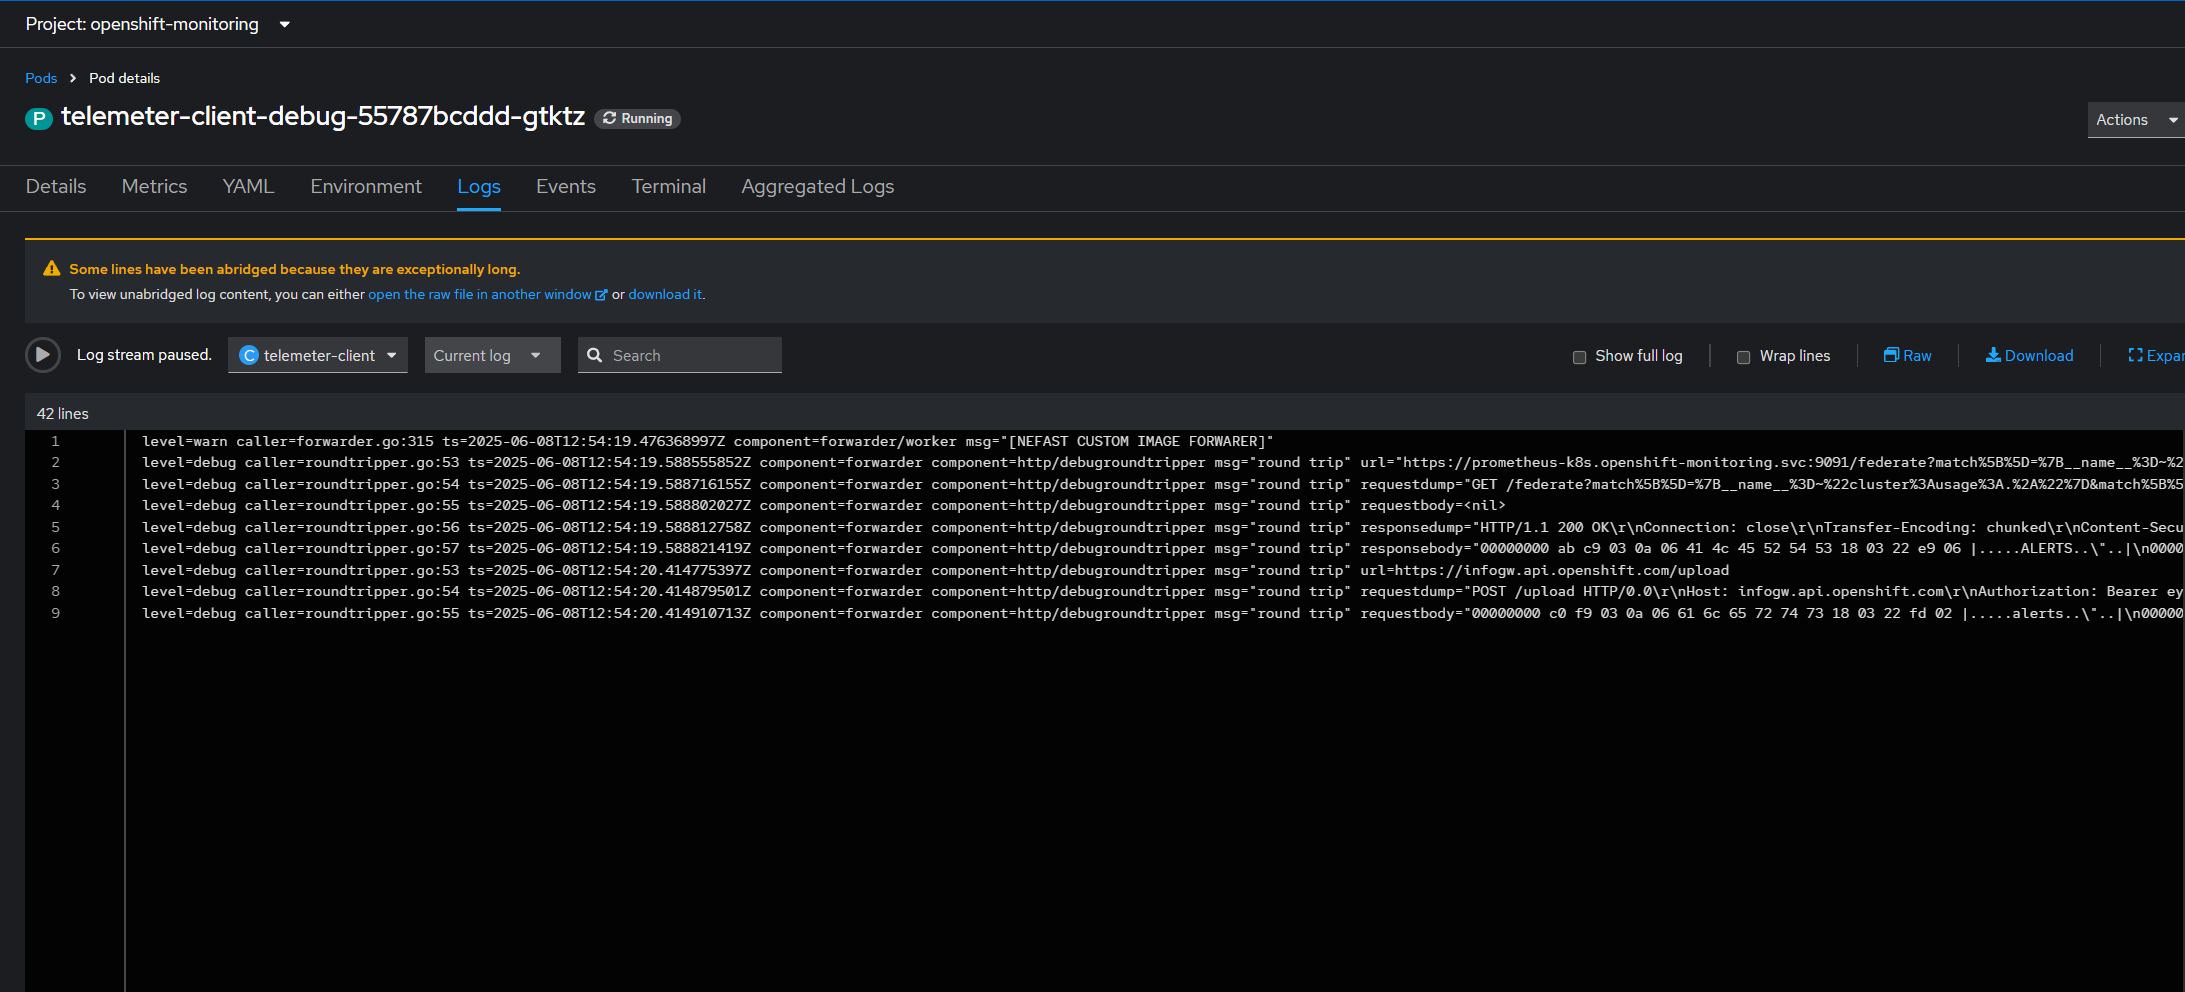
Since the pod is managed by an operator, let's copy the deployment and re-create it with another name, this will allow us to modify the container entry-point arguments to enable verbose logging.
Alright, this doesn't help us much either, fortunately, pretty much everything Red Hat uses is open source, so let's go look into the source code for the corresponding line and go from there.
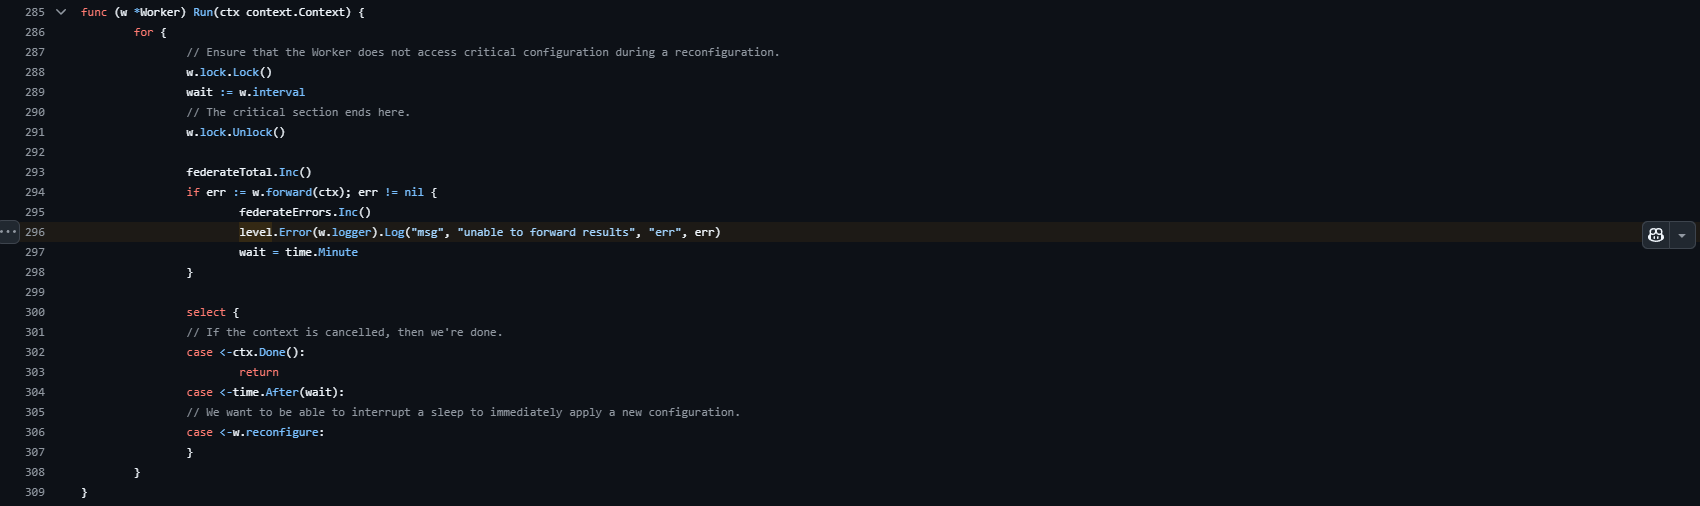
Found it, this seems like the main loop method for the thread responsible for sending the metrics to Red Hat's server. Now we just have to walk the stack trace manually and figure out why we end up in this condition.
Alright, we end up here. This is the function responsible of sending the data to the server, and we can learn a few things just from reading the code:
- It sends the metrics using Protobuf, a serialization format and library.
- It uses HTTP2 to send that request.
- It uses "snappy" to compress the data, this makes sense, as sending the metrics for each Openshift cluster without compression would put an unholy amount of stress on RedHat's backend
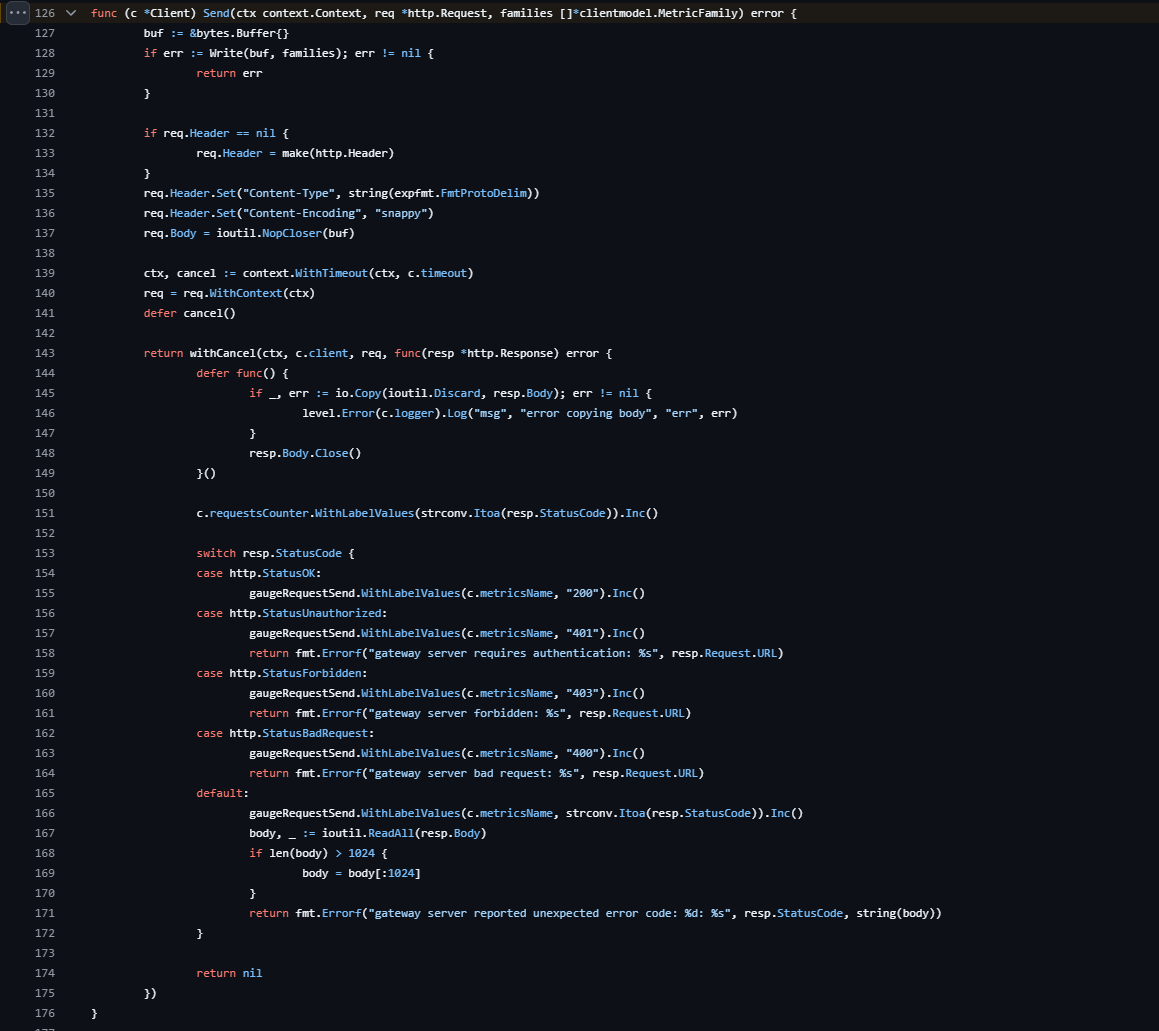
Let's take what we learned from this method, and convert all of it to a cURL request so that we can modify it easily to try and figure out why our proxy refuses it. Here's what I came up with:
curl -X POST "https://infogw.api.openshift.com/" \
  --http2 \
  -H "Content-Type: application/vnd.google.protobuf; proto=io.prometheus.client.MetricFamily; encoding=delimited" \
  -H "Content-Encoding: snappy" \
  --data "hello" \
  --max-time 30
Let's run it and pray that we get the same behaviour:
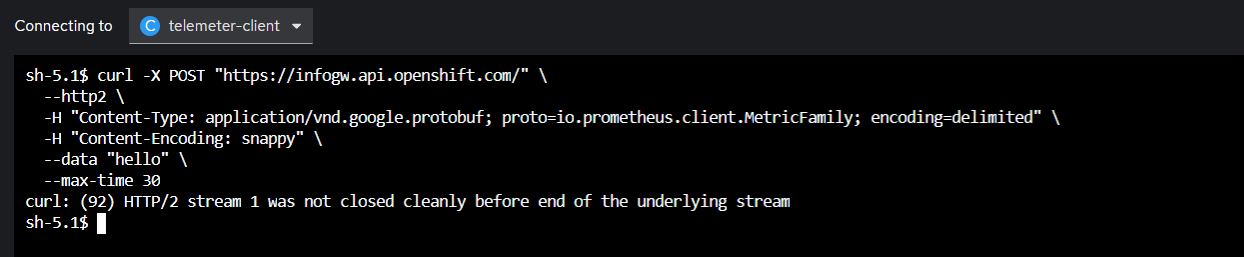
Bingo, now we're free to play around and see when it breaks. First let's start with the obvious move and disable http2:
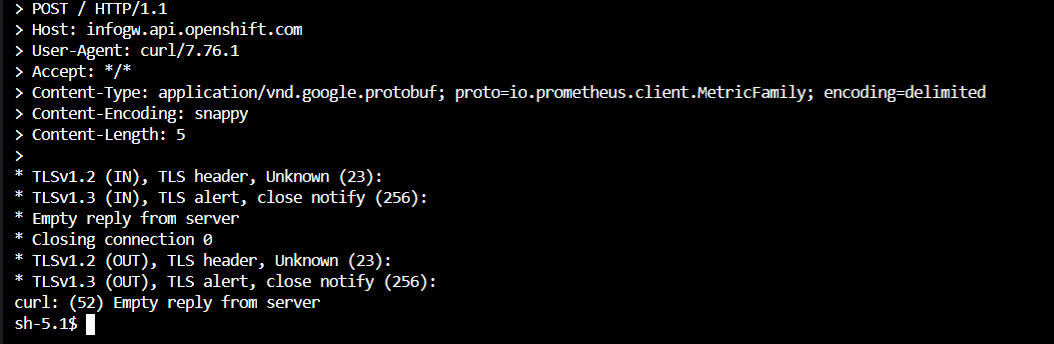
Mh, still broken. Let's try disabling the compression:
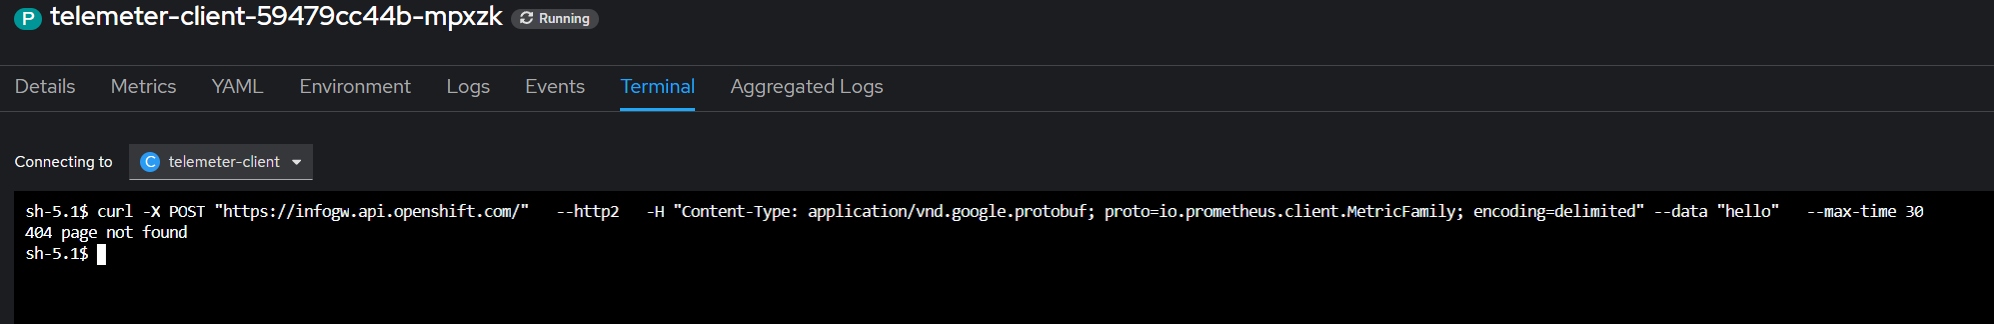
Nice, the request went through, it seems like the compression is causing issue at the proxy level, probably because "snappy" is not widely used in HTTP communications.
Let's confirm that by writing our own version of the telemetry client, completely removing the "snappy" compression. To do-so, we'll remove the Content-Encoding header and patch out the compression by modifying the write buffers:
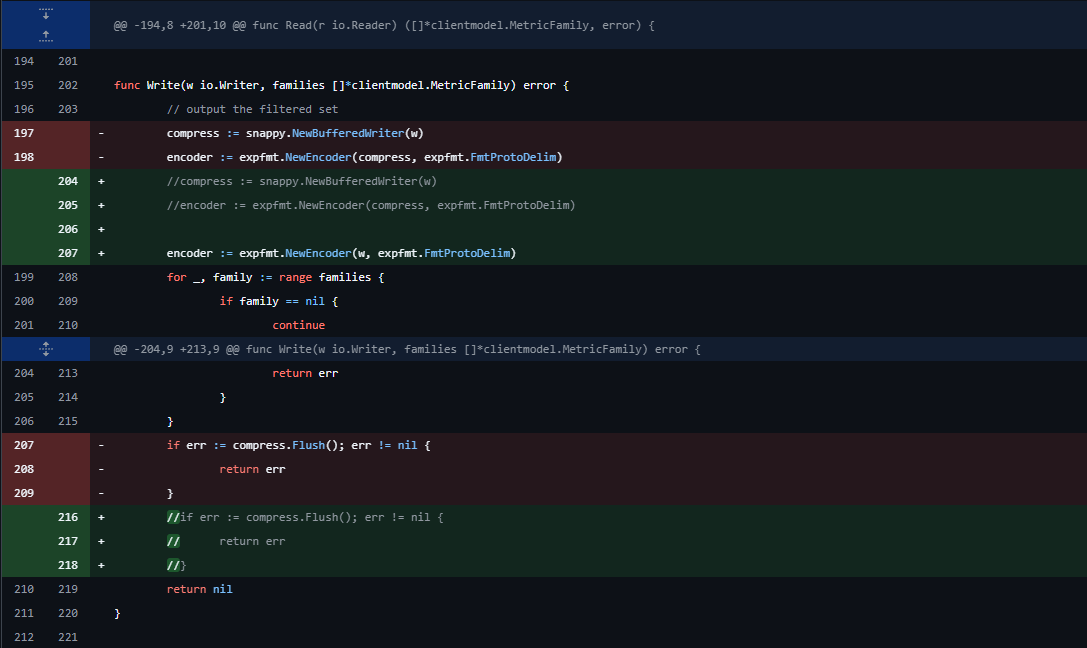
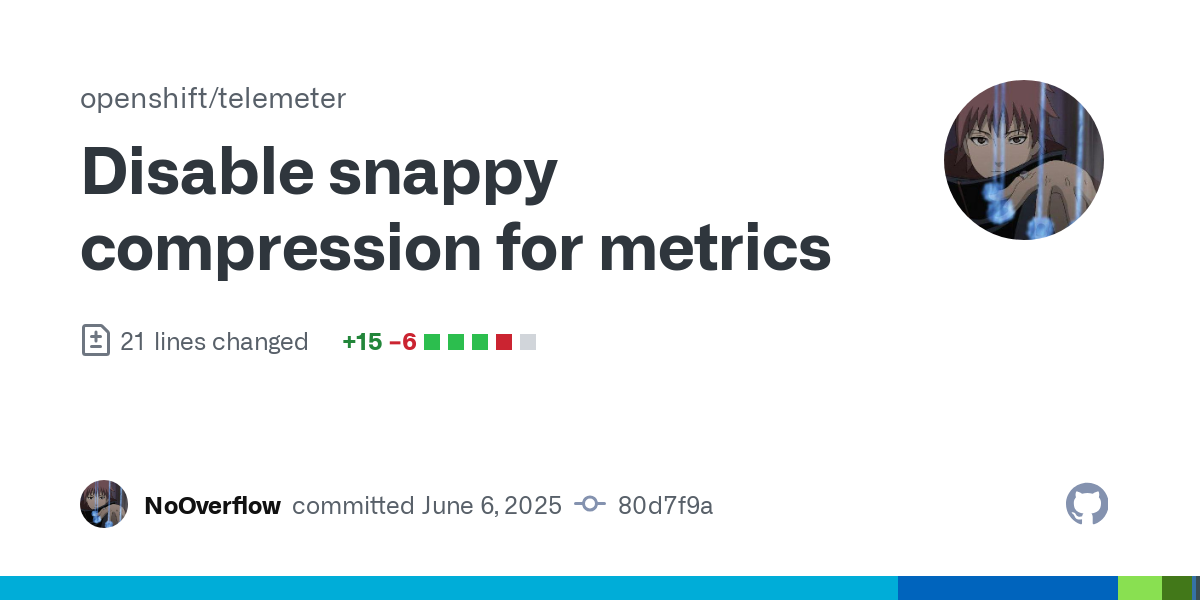
Let's compile it back into a container image using the repository provided Dockerfile, push it to DockerHub and modify the image in our deployment:
Bingo, we won, there are no more errors, and we can see our cluster back and alive in our hybrid console !

Unfortunately, we can't keep our telemetry client like that for two reasons:
- I can't propose this patch since I'm just disabling a critical feature, so I would have to manage my own fork and I don't have time for it.
- A RedHat employee would end up finding out and kidnapping me because of the additional stress I would put on them by sending tons of metrics uncompressed.
So the only solution we have is to go and bother the team managing our proxies internally, but this isn't interesting, so I'll just skip that part.
A rant on dodgy proxies
A proxy should not be meddling with requests and should not trust the values of HTTP headers.
That's it, that's the rule. First of all, a missing compression algorithm SHOULD NOT DROP THE REQUEST, for three main reasons:
- The Content-Encoding header can take any value; this is just a way to give a hint as to the compression used for the request, the backend does not have to respect it, and this is something that should be left alone when analyzing the content as a proxy because guess what PROTOCOLS ARE REFERENCES, NOT RULES.
Sure, you might argue that "rfc9110 defines a list of allowed Content-Encoding header values at https://www.iana.org/assignments/http-parameters/http-parameters.xhtml", and you would be correct but the horrible truth is that no one really cares about that. - Since the analysis by the proxy is usually done after the request, there's no point in dropping the request, just forward it anyway and send it as-is to the security team or face the hundreds of tickets you will get from applicative teams.
- "but but, muh threat actors": I'll tell you right now, anyone can just lie about the Content-Encoding header value, I could also just put valid gzipd data that is actually C&C commands encrypted with my own protocol and the proxy would be happy to forward it.
Thanks for reading all of my yapping until the end, cya 😄